Cross-Sport Fatigue Tracking Reveals Accumulator Prospects During Soccer and Basketball Playoff Runs
Theo Hayes · May 27, 2026
Cross-Sport Fatigue Tracking Reveals Accumulator Prospects During Soccer and Basketball Playoff Runs
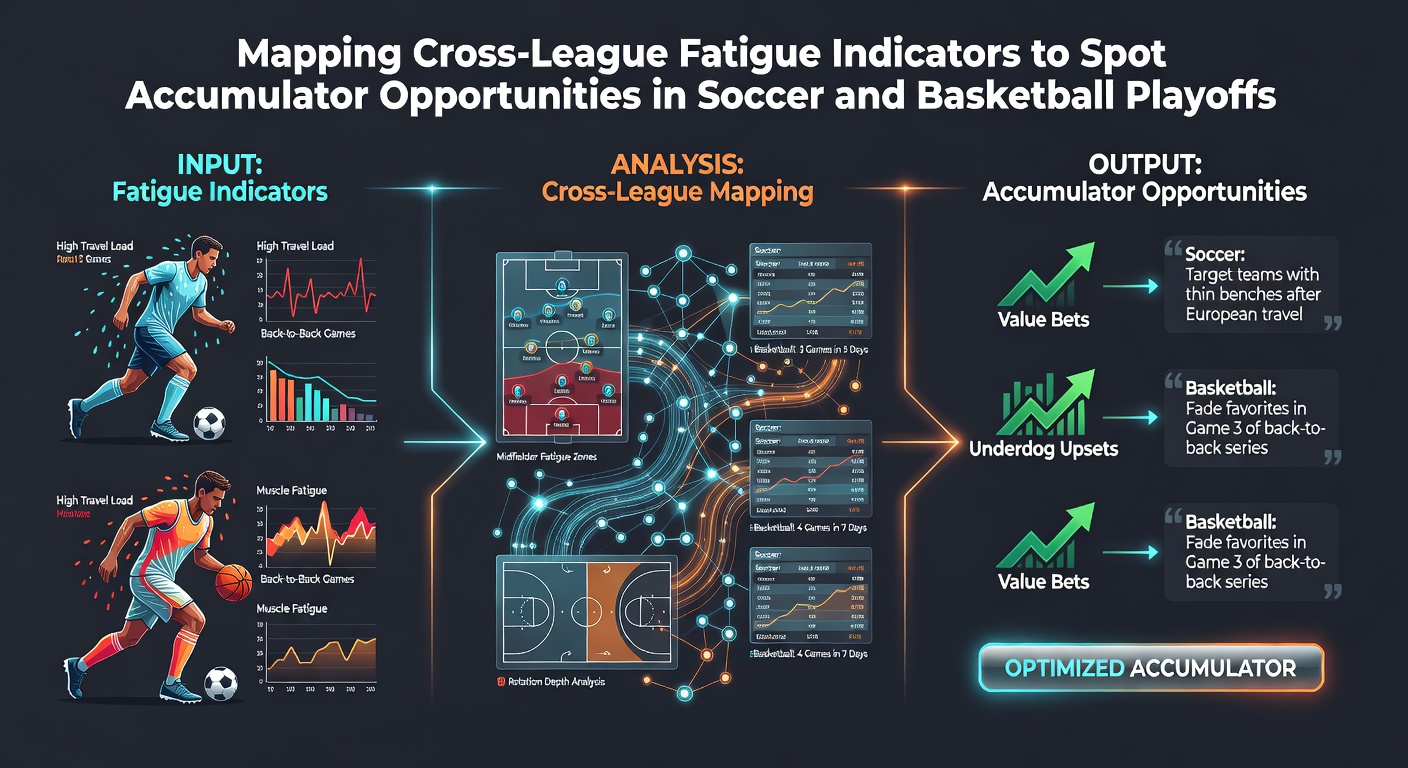
Playoff schedules in both soccer and basketball create overlapping demands on player recovery that analysts track through specific fatigue indicators, and these patterns feed directly into accumulator selections when multiple games occur within compressed windows. Back-to-back fixtures, extensive travel distances, and high-minute loads appear consistently in datasets from major leagues, while researchers compile these variables to highlight periods when performance edges shift. Observers note that May 2026 stands out because several European soccer knockout rounds coincide with the later stages of North American basketball postseason series, producing simultaneous opportunities to monitor cross-league recovery trends.
Core Fatigue Indicators in Professional Playoffs
Minutes played per game, days between matches, and cumulative travel hours form the primary metrics that performance staff and data teams use to quantify fatigue across both sports. Studies published in sports science journals show that basketball players logging over 38 minutes in consecutive nights experience measurable declines in shooting efficiency, whereas soccer squads traveling more than 1,500 kilometers between Champions League fixtures record higher rates of late-match substitutions. These indicators operate independently of team strength yet influence outcome probabilities when multiple legs of an accumulator involve teams under similar stress.
Soccer Playoff Recovery Patterns
Champions League and domestic cup schedules often force clubs into three matches within nine days, and UEFA technical reports document increased error rates in passing accuracy during the third fixture of such sequences. Midfielders and full-backs accumulate the highest physical loads because they cover greater distances while pressing, which creates identifiable windows where defensive lapses become more frequent. Analysts cross-reference these load spikes with historical results to isolate legs where underdog results occur at elevated rates, thereby constructing accumulator combinations that capitalize on the recovery gaps.
Basketball Playoff Load Management Signals
NBA postseason series extend the regular-season pattern of back-to-backs into seven-game sets, and league tracking data reveals that teams playing on the second night of a back-to-back win 7.2 percentage points less often than rested opponents. Centers and power forwards show the steepest drops in rebounding percentage after consecutive high-minute outings, according to Basketball Reference advanced metrics. Playoff coaches adjust rotations earlier in these scenarios, which alters point totals and spread margins in ways that accumulator builders incorporate when pairing basketball games with soccer fixtures on the same ticket.
Integrating Indicators Across Both Sports
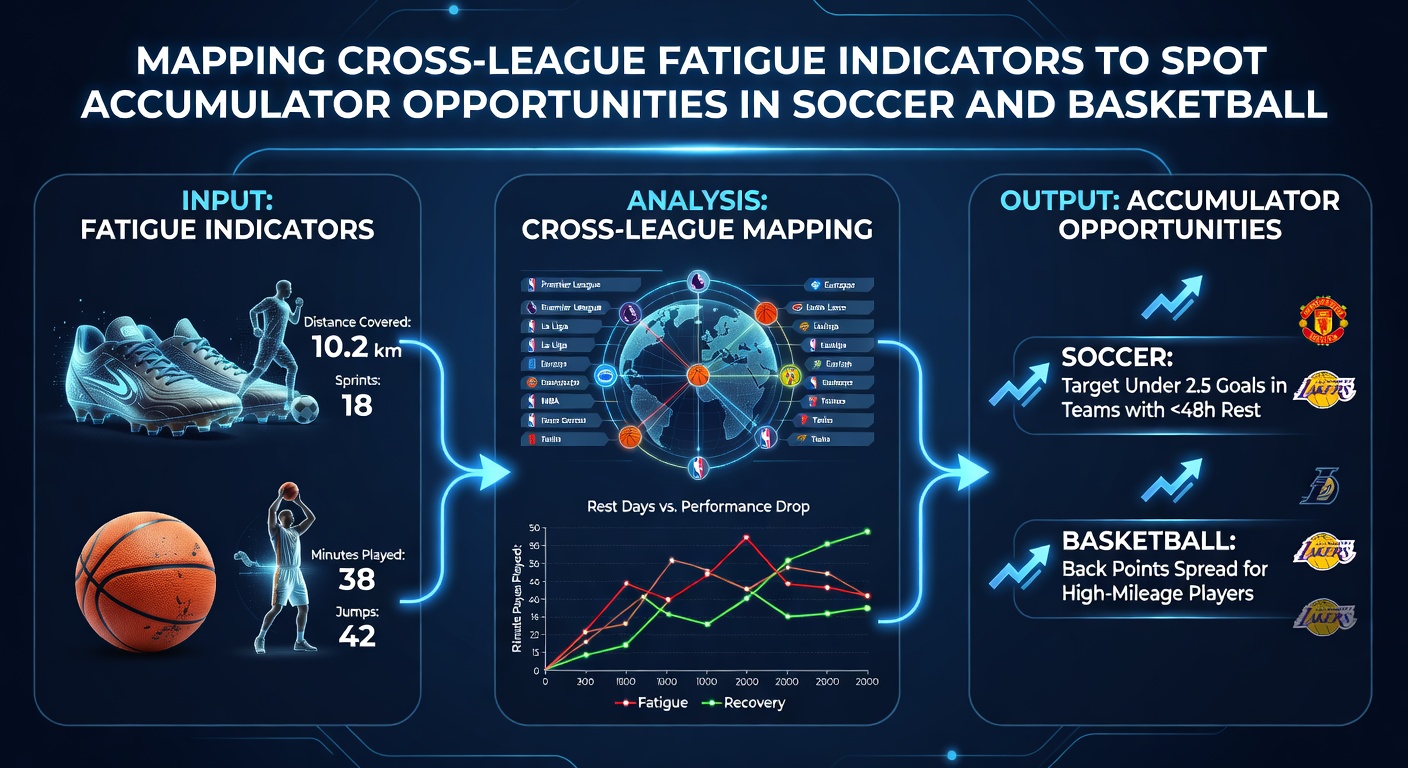
Mapping tools combine soccer and basketball datasets by normalizing fatigue scores to a common scale that accounts for sport-specific movement profiles, and this process highlights calendar dates when multiple teams across leagues face elevated recovery challenges simultaneously. For instance, when an NBA conference final coincides with a Champions League semifinal second leg, the joint probability of defensive lapses in both sports rises, which researchers have quantified through regression models that weight recent travel and rest differentials. Accumulator strategies built on these dates select outcomes that align with the documented performance decrements rather than raw team rankings.
Practical Application in Accumulator Construction
Betting syndicates and independent analysts feed the normalized fatigue scores into probability models that generate adjusted odds for individual legs, then compare those adjusted figures against market lines to identify value. One documented approach involves selecting three soccer underdogs and two basketball overs on nights when aggregate fatigue indices exceed seasonal averages, because historical samples show those selections cover at higher frequencies. Data from the Australian Institute of Sport on multi-sport recovery protocols supports the underlying premise that cross-training and travel effects compound when athletes from different codes experience parallel stressors, even though the athletes themselves never compete against one another.
Calendar Overlaps Through May 2026
The 2025-26 NBA postseason timeline places conference finals in late May, overlapping with UEFA Europa League and Conference League decisive matches that also conclude that month. Scheduling data released by the leagues shows that several high-profile clubs and franchises will enter these rounds with limited rest, and the resulting fatigue clusters create concentrated periods for accumulator targeting. Observers track these overlaps months in advance because the fixture lists remain fixed once the regular seasons conclude, allowing models to pre-compute fatigue projections that update only when injuries or postponements intervene.
Conclusion
Cross-league fatigue mapping supplies a structured framework for identifying accumulator opportunities by converting raw schedule data into comparable recovery metrics that apply equally to soccer and basketball playoffs. As May 2026 approaches, the alignment of major knockout stages offers repeated test cases for these models, and continued collection of performance statistics will refine the precision of the indicators used to flag value within multi-leg bets.