Matching Global Line Variations to Performance Momentum in Elite Basketball and Tennis Competitions
Rafael Albrecht · Jun 17, 2026
Matching Global Line Variations to Performance Momentum in Elite Basketball and Tennis Competitions
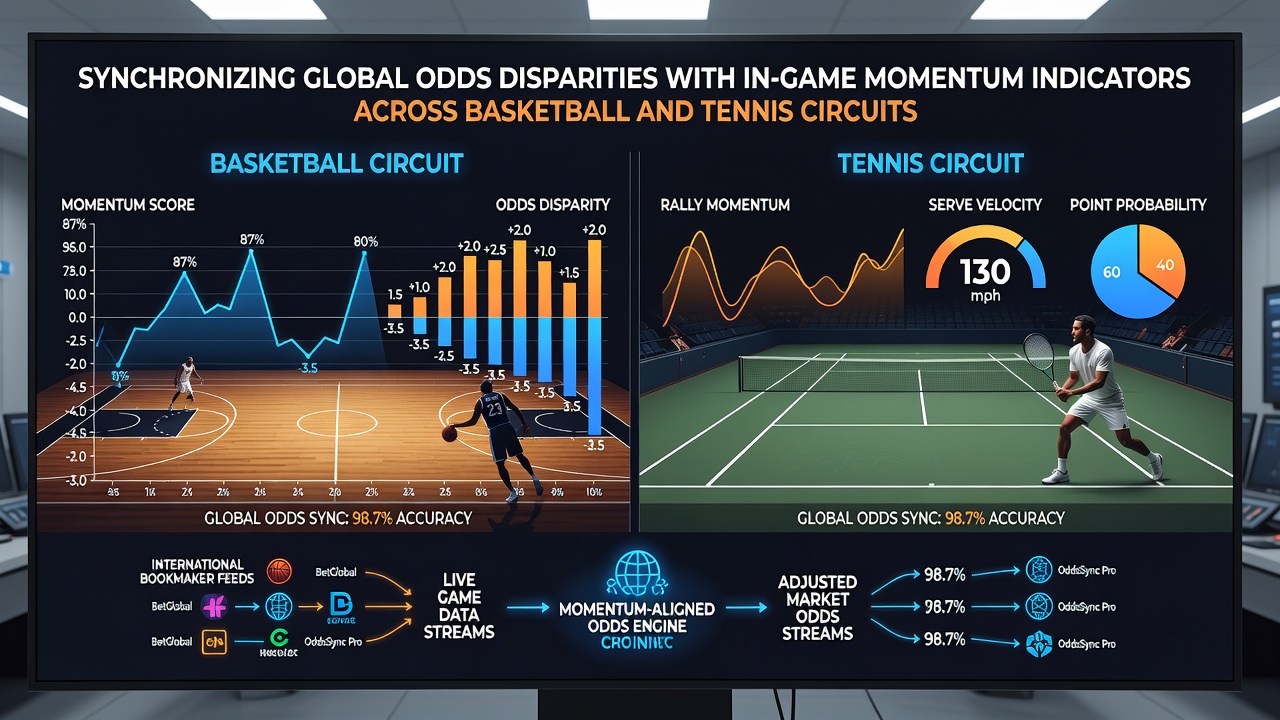
Bookmakers across different regions post varying odds on the same basketball and tennis fixtures, creating measurable disparities that widen or narrow as matches unfold. Observers note these differences often align with shifts in on-court momentum, such as scoring runs in basketball or consecutive service holds in tennis. Data from major circuits shows that tracking both elements together provides structured insights into how lines move during live play.
Understanding Odds Disparities Across Markets
Regional operators adjust prices based on local betting volumes, regulatory requirements, and access to sharp money, which leads to temporary gaps between European, Asian, and North American books. Researchers tracking these gaps during the 2025-2026 seasons found average spreads of 3-7% on NBA moneyline markets and similar ranges on ATP matches. These gaps tend to compress when in-game indicators signal clear momentum changes, because global liquidity responds faster to visible performance trends.
Momentum Indicators in Professional Basketball
Basketball circuits generate frequent momentum signals through metrics like effective field goal percentage swings, turnover rates over rolling five-minute windows, and pace-adjusted scoring margins. League data compiled by the NBA and EuroLeague indicates that teams sustaining a positive scoring run above a set threshold see their implied win probabilities rise sharply within minutes. When these runs coincide with wider odds gaps between Asian and European books, bettors who monitor both elements can identify brief windows where one side of the line offers relative value before lines converge.
Key Basketball Metrics Used for Synchronization
- Rolling plus-minus over the last eight possessions
- Three-point attempt rate changes during opponent timeout sequences
- Rebound rate differentials in transition periods
Analysts cross-reference these figures against real-time line movements posted by multiple operators. Studies released by sports analytics groups in early 2026 documented cases where a sudden 12-point run correlated with a 4% tightening of global spreads within two minutes of play.
Momentum Indicators in Professional Tennis
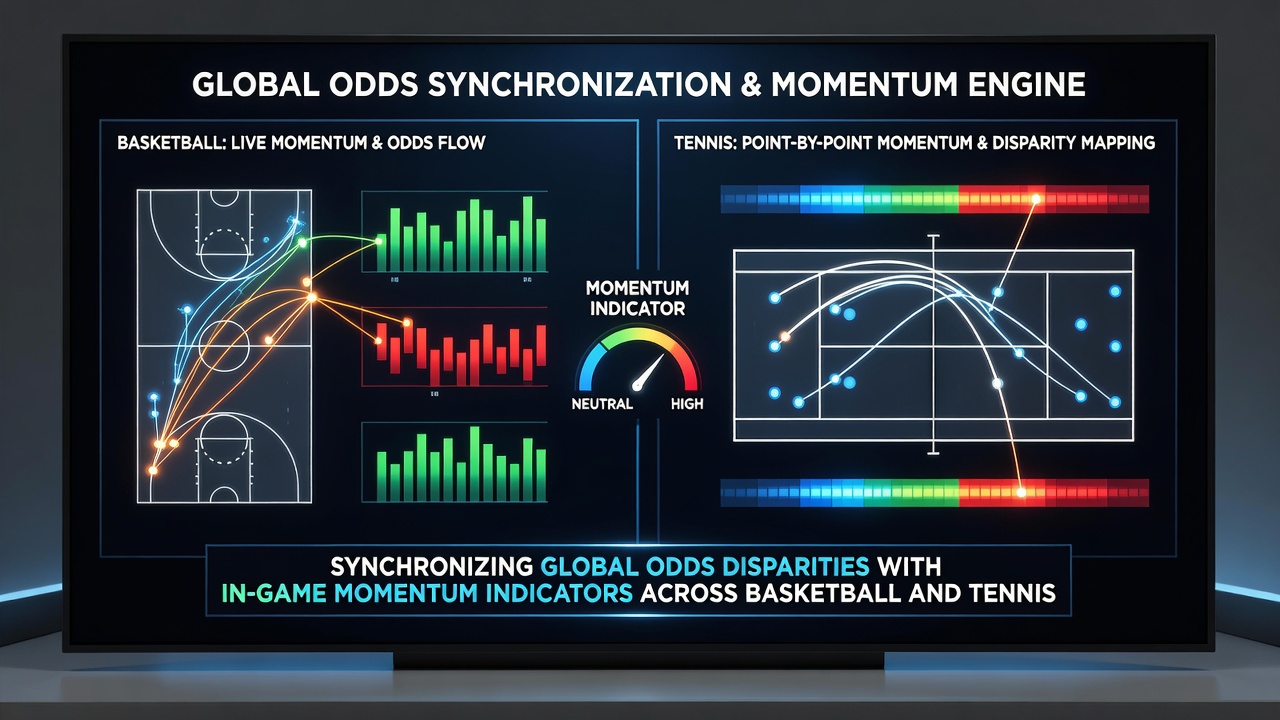
Tennis produces momentum through service break streaks, first-serve percentage shifts, and unforced error clusters over recent games. Data aggregated from WTA and ATP events shows that players converting more than 60% of break opportunities in a set often see their live odds improve by 8-12 points across major betting exchanges. Because tennis matches feature natural pauses between points and games, these indicators allow slightly longer reaction times compared with the continuous flow of basketball.
Global odds on individual games or sets frequently diverge during extended rallies or after medical timeouts. Observers tracking both ATP Masters and Grand Slam events in June 2026 noted that discrepancies between Australian and European operators widened most noticeably during third-set tiebreaks when one player held serve for four consecutive games.
Methods for Aligning the Two Data Streams
Professionals combine live momentum feeds with multi-book odds scrapers that refresh every 15 seconds. Software platforms pull performance data directly from official league APIs while simultaneously logging price changes across licensed operators. When a basketball team's transition efficiency spikes above its season average, the system flags any books whose lines have not yet adjusted to the same degree. Similar logic applies in tennis when first-serve win rates climb above 75% over a service game sequence.
Industry reports from organizations such as the International Betting Integrity Association highlight that synchronized monitoring reduces exposure to stale lines. Academic papers published through sports science departments at European universities further confirm that models incorporating both momentum variables and cross-market spreads achieve higher calibration scores than those using either data type alone.
Practical Examples From Recent Circuits
During the 2026 NBA playoffs, one Western Conference series featured repeated instances where a team's defensive rating improved by 15 points per 100 possessions over a single quarter. Global moneyline spreads narrowed from 6% to under 2% within 90 seconds of those stretches becoming statistically evident. In tennis, a notable French Open quarterfinal match saw odds on the underdog tighten after three consecutive breaks of serve, with Asian books moving faster than North American exchanges and creating a brief arbitrage window.
These patterns repeat across both sports because momentum shifts are visible to all market participants at roughly the same moment, yet liquidity and risk-management rules differ by jurisdiction. Consequently, temporary misalignments appear and then resolve as operators update their models.
Conclusion
Global odds disparities and in-game momentum indicators operate as interconnected signals rather than isolated factors. Basketball and tennis circuits generate abundant real-time statistics that, when paired with multi-market line tracking, reveal how prices evolve during live events. Continued development of integrated data tools allows systematic observation of these relationships across different regions and tournament stages.