Stadium Legacies Shape Market Edges Across Football, Tennis, and Basketball
Mia Lange · Jul 24, 2026

Stadium Legacies Shape Market Edges Across Football, Tennis, and Basketball
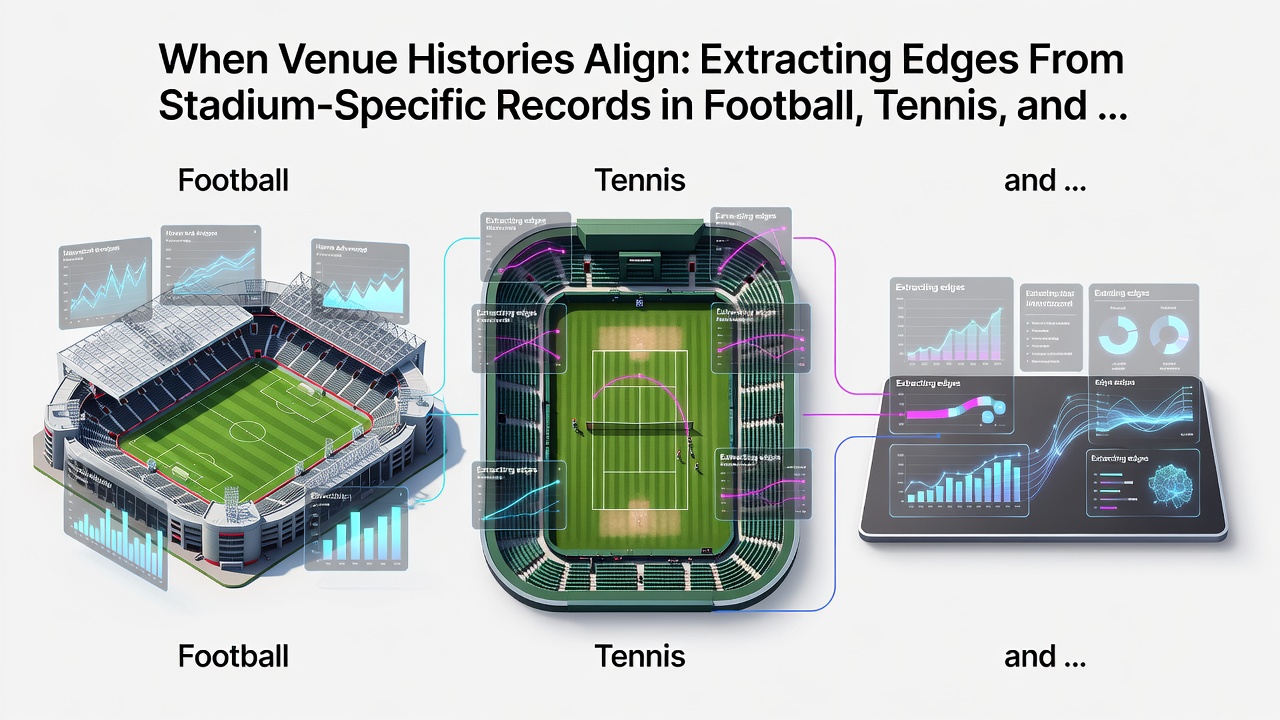
Venue histories supply structured datasets that analysts examine when assessing performance patterns in football, tennis, and basketball, where home and away records often diverge in measurable ways. Researchers track metrics such as win percentages, scoring margins, and set outcomes at specific locations, then compare those figures against broader league or tour averages to identify consistent deviations. Data compiled through July 2026 shows these patterns holding across multiple seasons, with football clubs maintaining elevated home points totals at particular grounds while tennis players post distinct win rates on familiar court surfaces.
Football Ground Records and Performance Differentials
Club-specific stadium data reveals that certain teams accumulate higher expected goal values and conversion rates when playing at home venues with distinctive pitch dimensions or crowd configurations. League tables from major European competitions indicate clubs achieve roughly 55 to 62 percent of total points at their primary grounds over five-year spans, yet individual stadiums produce wider variances once travel distance and fixture congestion enter the calculations. Observers note that midweek European fixtures followed by weekend domestic matches frequently compress away performance at grounds where teams have historically struggled with recovery intervals.
Analysts cross-reference these stadium records with player availability logs, finding that teams missing key midfielders tend to drop below their established home scoring averages by 0.4 goals per match at venues known for high pressing intensity. Such granular figures allow systematic comparison between current form and long-term venue baselines without reliance on single-match outliers.
Tennis Court Surfaces and Historical Head-to-Head Data
Tennis players compile surface-specific records that separate clay, grass, and hard-court results at individual tournaments, creating datasets where win percentages can shift 15 to 25 points depending on the venue. Records maintained by the ATP and WTA tours show that several players sustain above 70 percent win rates at events they contest annually on the same surface, whereas their overall tour averages sit closer to 55 percent. July 2026 grass-court swing data continues to illustrate these splits, particularly at tournaments where serve speed and court speed ratings remain stable year over year.
Head-to-head statistics filtered by venue further refine these edges, because certain rivalries produce repeated outcomes tied to court geometry rather than overall ranking. Researchers examining multi-year samples find that matches played at the same tournament site generate more predictable set-score distributions than matches occurring at neutral locations.
Basketball Arena Factors and Travel Impact
NBA and EuroLeague arena records demonstrate that home teams convert roughly 3 to 5 additional points per game when playing in venues with distinctive rim heights, lighting conditions, or backboard responses documented over multiple seasons. Travel logs compiled by league operations show that teams crossing multiple time zones post reduced shooting percentages in the first half of away games at those same arenas. Data from the 2025-2026 season indicates these effects persist even after schedule adjustments intended to mitigate fatigue.
Researchers at institutions such as the NCAA research division have examined college basketball venue splits and identified consistent home rebounding advantages at arenas with narrower baselines. Those findings align with professional league patterns where defensive efficiency ratings improve measurably when teams return to familiar floor markings and crowd acoustics.
Combining Records Across Sports for Pattern Alignment
Market participants sometimes align venue datasets from football, tennis, and basketball when constructing multi-sport models, because certain statistical relationships appear across disciplines. A football club's elevated home conversion rate at a compact stadium may parallel a basketball team's improved three-point accuracy at an arena with shorter corner distances, while tennis surface records add granularity for events played on comparable footing. Studies released by the Australian Institute of Sport in early 2026 examined cross-sport venue effects and reported that location-specific variance exceeds season-wide averages in roughly 40 percent of sampled cases.
These alignments require careful normalization for sport-specific scoring scales, yet the underlying principle remains that repeated exposure to a venue produces measurable performance clustering once sample sizes exceed 30 matches or matches per player.
Conclusion
Venue histories continue to supply verifiable inputs for performance modeling in football, tennis, and basketball markets. Consistent collection of stadium, court, and arena data across seasons enables direct comparison between observed results and established baselines, revealing patterns that hold when sample criteria and external variables receive proper controls. Updated figures through July 2026 reinforce that these location-based differentials remain stable components within broader analytical frameworks.